
David Maynor and Paul Judge with Barracuda Labs give a Defcon presentation reflecting their research on malware distributed via online search resources.
 Dr. Paul Q. Judge (Chief Research Officer and VP at Barracuda Networks): Good afternoon, thanks for joining us for this session. I am Paul Judge, this is David Maynor. What we want to spend some time on today is search malware, we’ll also share with you some of the results that we’ve seen. For probably the last several months, we have been looking into this issue. Certainly, over the last year, there have been many examples of malware poisoning our popular search terms. And we’ve all seen examples over the last year.
Our goal was to really kind of understand how much this is happening, understand where it’s happening, understand a little bit more about how it’s happening.
And so, as we dug into this, we realized that one of the things here that was pretty obvious is kind of – why the attackers are focused on the search engines.
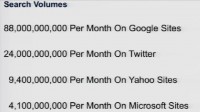
The number of eyeballs that are showing up on the search engines every day is growing rapidly. I mean, if you look at the latest numbers from the search engines, if you look at Microsoft, look at Yahoo, even Twitter now, and Google – there are hundreds of millions of searches done on each one of these every day. Microsoft totals in at over 4 billion searches a month, Yahoo! at over 9 billion, Twitter now is claiming over 24 billion, and Google leads with over 80 billion searches a month.
So the point is, as more information, more users come online, we all use search engines more and more. I know, I have personally come to the point that I am so lazy that even when I know I’m going to the site like CNN, instead of just typing cnn.com, I don’t have time to type the actual 4 characters, so I just put it into my search toolbar and let it to work. I see a lot of heads in the audience, so a lot of people have kind of developed that habit.
So the point is that there are so many people going to search engines every day, and the attackers realize that this is a pretty good place to focus to get a lot of eyeballs.
And so, what we wanted to do was understand how they are targeting particular terms, how much they are targeting particular terms, whether there are particular categories that are more popular, and so forth.
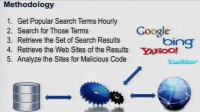
So with that, we set up a system, a methodology to crawl different search engines. And it actually around the clock pulled and looked at what the most popular search terms were, for Yahoo, for Bing, for Twitter and for Google. And we looked at those most popular search terms around the clock and looked what were the search results for those. And so we pulled those search results, and then actually pulled the pages that those were pointing to, and analyzed them.
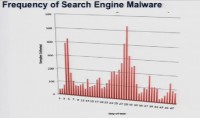
So what we looked at was 4 different search engines over about 2 months, 57 days to be precise, and in that timeframe over 25,752 popular topics that we examined, and then over 5 million actual search results.
So we’re gonna dig into what we found. So, you know, one of the first points is – we found malware. Anybody surprised by that? Over 8000 examples of malware across the different engines (see histogram).
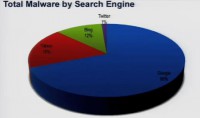
And if you look at the breakdown, the leader is Google, with 69% of the malware that we found being found on results from the Google search engine. After that was Yahoo, with 18%; and Bing, with 12% (see diagram). This is one of the first times in my life Microsoft actually has this advantage of having a little market share, so kind of being the least attacked platform. The other one you see there is Twitter, with 1%. And at first, it was a little strange to us because we are pretty familiar with how much malicious activity misuse was happening on Twitter. But one of the things we understood as we dug into this is as follows: well, think about how search engine works, it actually organizes and ranks results; and so it makes it pretty easy for an attacker to use search engine optimization to actually make sure they are in that set of results that a user gets.
Whereas with Twitter, for most of the time, the way their searches work is they just give you a snapshot of who’s talking about this right now. So there is no ranking, there is no prioritization, and for an attacker to try to poison a search engine, they’re gonna make sure they get their attacks in the top. For Twitter, they are more kind of playing the odds and seeing where they end up in that random string. And so that’s what explains it’s only 1% number. But as we get further along, we’re gonna show some examples of specifically the type of things that are happening inside of Twitter.
While analyzing the daily activity for each of the engines, we saw that everyday Google led the pack; on different days, different engines had a little bit more, or less. But what becomes interesting is that pretty much every day each engine led to something malicious. You know, no engine really took a day off.
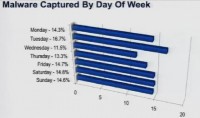
But if we look at the different days of the week, one of the first things that we want look at is, if you look across the week, are there particular days that have more activity (see histogram). The short answer is ‘No’, not really. Tuesday led a little bit, representing about 16.7% of the overall malware for the week. But there wasn’t a strong correlation about the day of the week.
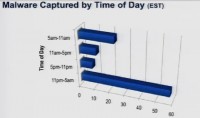
But this got a little interesting if we looked at the time of the day (see histogram). These time periods are based on an Eastern Standard Time. If you look at the 11 PM to 5 AM interval, really over 50% of the malware was found in this cycle. So what we’ve seen is that in the 11 PM – 5 AM slot, over 50% of malware was showing up, so if you think about this engine running around the clock, pulling in the popular search terms, pulling in the results, and then analyzing those, we had over 50% of activity in that 6 hour block, that was the end of the night.
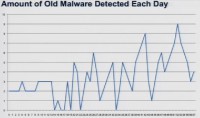
Paul Judge: Another question that we looked to answer was whether these were known attacks, whether these were attacks that we knew – kind of what types of attacks or malware they were using in their search poisoning. So this looks at the amount of malware that was detected each day that was found on the previous day, but wasn’t detected till later (see graph).
 David Maynor (Errata Security CTO): Let’s go back for a second – so, the malware captured by time. Well, everything in my world is defined by Eastern Standard Time, which is the best time zone. However, we take a look at rate, and no one on the East Coast is working between 11 PM and 5 AM. So if you take a look and correlate this – who is working are generally are people in Eastern Europe or in Asia somewhere. That kind of fits in what we call a ‘hacker time’, you just have to invert the time that you would think normal people work, and make that the ‘hacker time’.
So the malware detected each day is kind of a funny thing because, well, when we went on this research we had our own biases, we had ideas of what we’re trying. And the days that seemed to have the most malware were the days of the biggest pop culture events, like the MTV Music Awards, you know, things like that. And this kind of represented in chart. So we started this research, and the research ran for 57 days, and that’s а number we picked that we felt would be a good indication of, you know, total traffic.
So it ran for 57 days from, you know April to June, and there was a lot of kind of pop culture stuff happening, as you see towards the end of the graph, that’s world cup malware and stuff like that. In the beginning it’s more, you know, Justin Bieber malware – he is the primary reason why peoples’ machines get infected. So if you have kids and they buy Justin Bieber CDs, tell them you’re gonna get viruses.
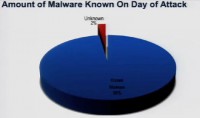
Paul Judge: One of the points here is that 98% of the malware that we found on search results, was identifiable by the techniques that we used. So that’s one of the things to understand, if you look at the results that we pulled and the ways that we analyzed them.
So we used three different methods. One was a traditional category based URL filtering database – so kind of looking at the URL and seeing what category of site this is. Everybody can understand the limitations there. The second source that we used was Google Safe Browsing lookups. The third type of analysis that we used was a malicious JavaScript detector. And so what this does is it actually pulls the JavaScript that’s sitting on a page, and looks for behavior that indicates unwanted activity, looking for too many createElement’s and similar things.
So those are the 3 detection techniques that we used to find the different malware. And the point here is 98% of the malware that were on these search results were detectable. Kind of the good news is that attackers aren’t using kind of true zero-days on the other end of search results. 98% of the stuff is detectible if someone was actually using something in between them.
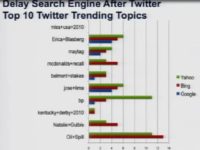
Top 10 Twitter trending topics
One of the other interesting things that we came across is the relationship between different search engines. If you look at something that pops up on Twitter versus something that pops up on Google, or Bing, or Yahoo – we tried to see what is the difference in time, in the delay: for example, the time that it shows up on Twitter or the time that it shows on different search engines. And so let’s take a look at this. Let’s take a look at the top 10 trending topics on Twitter, and look at how long it took them to show up on different search engines (see histogram). The green bar here is the number of days on Yahoo, the red bar is on Bing, the blue bar is on Google. And if there is no bar – it didn’t show up on the other search engines.

So what you see is this delay (see histogram). What happened is on average it took 1.2 days for something to become a trending topic on Google after it became a trending topic on Twitter. It took 4.3 to become a trending topic on Bing, and 4.8 days on Yahoo!.
What’s interesting is the set of things that were the trending topics on Twitter: there were things that were trending topics on the search engines that were not on Twitter. We saw that in general things that were kind of culture related or pop related became trending topics on Twitter first. And things like more serious news, like election results – those things became trending topics on search engines before they became trending topics on Twitter.
That’s one of the points for understanding, from attackers’ viewpoint, where you should target your attacks first. If you see the time one thing moves from one network to another and it’s gonna be popular, it’s gonna become something that people are searching for, this is a pretty interesting roadmap for where you should spend your attention early on, in a particular event that’s happening.
David Maynor: So when you go home, make sure you tell your kids that if they search for news sites, they are less likely to get malware than if they’re gonna search for Justin Bieber. We really don’t like that kid, I have to be honest.
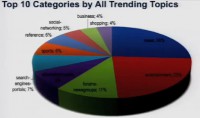
Paul Judge: Here is the view of all the trending topics that we looked at: over the 25,000 trending topics, what type of sites were trending, so what are the categories? And so one of the top things here is news: 26% of the sites that were trending were news sites. After that was entertainment, so 23% of the sites were entertainment. And after that were things pointing to news groups and to streaming media, and so forth. So no big surprises here – people like news, and people like entertainment.
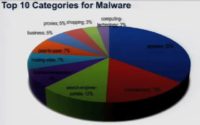
Right now, if you take a look at the top 10 categories for malware, it’s a little bit different. You know, one of the things that you see here is that the top category is spyware. So 35% of the sites that were pointed to were classified by traditional URL filtering engine as being bad sites. These were sites that were known to continually carry malware over time. The good news is we could catch this based on web filtering technology. But then you see entertainment here, you see search engines here, you don’t see news pretty high up in the results.
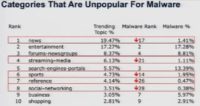
So one thing we wanted to look at was whether there were particular categories that malware liked or didn’t like. These are the top 10 categories overall, news being 1, then entertainment, then forums and newsgroups. If you look at the 3rd column, that’s the ranking for malware. So news – while it was the number one sites overall for trending topics, it was number 17 for malware. If you look at streaming media, it is number 4 overall, and it is number 21 for malware. Sports – similarly, number 6 overall but 14 for malware. So this shows examples of the types of sites that malware authors don’t particularly like to target.
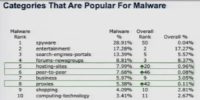
But then, if you look at categories that are popular, you see some names that you would expect. You see that overall the malware ranking for hosting sites is number 5, where in general it’s 20. If you look at peer-to-peer, it’s number 6 for malware but number 46 overall. So you see some of the usual suspects: hosting, peer-to-peer and proxy sites being targeted by the search terms where they’re leading to.
Paul Judge: We dug into the different networks, and we dug into Twitter – that’s a good example because their API is so open, it gives us the ability to easily ask questions, but on the other side it also gives the attackers the ability to kind of also easily create lots of accounts and also easily inject lots of content for very little costs, in terms of computing and bandwidth.
We have about a little over 25 million Twitter accounts that we’ve analyzed. So you think about this whole set of over a 100 million Twitter accounts that exist, we have access to over 25 million of those that we’ve examined. It’s pretty substantial sample, or subset of the Twitter universe.
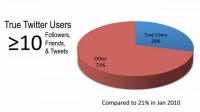
After looking at that, one of the first questions that we wanted to ask was – what’s an actual Twitter user, what’s a true Twitter user? I’m sure most people in this room are true Twitter users. And we set the bar pretty low: we say a true Twitter user is somebody that has in at least 10 tweets, they have at least 10 people following them, and they are following at least 10 people (see diagram). This is a pretty low bar for you guys that have actually used the network. But what we saw is only 29% of the accounts on the network meet those criteria. Just think of about it, 71% of the accounts on Twitter really aren’t using it. So this was kind of the first thing that we noticed, I mean the vast majority of the network is not using it.
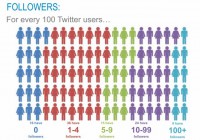
We looked at it a little more closely, and what we saw was how many followers each account had (see image). The point here is 16% of the accounts have no followers. Think about this. Basically 1 in every 6 accounts on the network – nobody is listening to them. You know, over half of the network, 52% of the network, have less than 5 followers. So a couple of people listening, but not many people care. But it’s interesting only 9% of the network has over a 100 followers – so a very small set of the overall population of people are tuning in to them and listening to what they’re saying.
David Maynor: What’s funny, it seems the Twitter has become high school again – there are some people known to only 5 people, and then there are people that everybody knows.
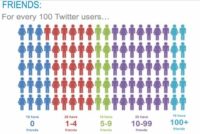
Paul Judge: Exactly. So that’s kind of the set of who is following (see image). The thing we looked at next is how many people you are following. And the point here again is – out of all the accounts on Twitter, 19% of them are not following anybody. They went on and created an account, and they don’t care to listen to anyone, 1 out of 5 accounts following nobody. There’s only 10% of the accounts that are following more than 100 people, so only 10% of the people are interested enough to actually pay attention around the clock.
The next thing we looked at, it’s kind of more interesting, was the relationship between those 2 numbers. You know, if you think about normal social network, you are following the same number of people that are following you; if you think about Facebook, Myspace – it’s a mutual relationship, it’s kind of a two-way connection, whereas with Twitter you have this opportunity to have it one way.
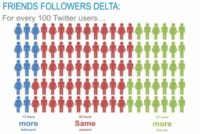
And so what we saw was that 55% of the network is actually using it with a kind of a two-way pattern (see image). They have roughly the same number of people following them as they’re following, plus or minus 5, that’s the criteria that we used. So 55% of the network is using it like a normal social network. What we saw was that 13% have more followers than the number of people they are following. The other side is – 32% of the network is following more people. So it really shows that about half the network are using it like friends, there are about 13% that are celebrities, and there are about 30% that are consumers of content.
One other thing we wanted to look at was how many of these are real accounts, how many of these are legitimate people and legitimate accounts. So we looked to examine this thing that we call the Twitter crime rate. And the Twitter crime rate is the percentage of accounts every month that are created and then suspended. And these are suspended by Twitter. So this is obviously not all the accounts that are doing things that are malicious, but at least a measure over time of how many accounts were created doing malicious misuse and then kicked off the network.
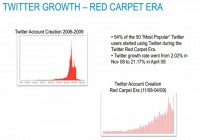
Let’s look back since the beginning of the network (see image). This top left view is the view since the beginning of the network, the growth of the network. This is the user growth of Twitter since 2006. One of the interesting things that we saw is this Red Carpet Era. If you look at this from November 2008 to April 2009, what happened is, you know, all the celebrities came. So if you look at the top 100 people on Twitter today, 50% of them joined the same 6-month period. So the Ashton Kutchers, the Kim Kardashians all over the world joined the network during this 6-month period. If we look at what it did to the growth rate of Twitter, it went from 2% to 20% a month, in a 6-month period.
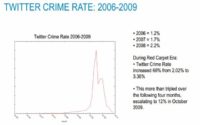
So what happened there is we know that where the users go, the attackers go. So let’s look at the Twitter crime rate since the beginning of the network (see graph). So since 2006 when the network first started, there was 1% of the accounts that were created in any given month, that were suspended or kicked off by Twitter. You look at 2007 – it went up to 1.7%. In 2008, it went to 2.2%. In the middle of this Red Carpet Era, it increased 66%: from 2.02% to 3.36%. But 4 months later the crime rate jumped to 12%.
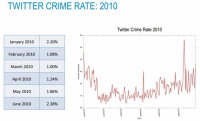
So 1 in very 8 accounts that were created on this network were being kicked off. And again, these are only the ones that were being found. It then came back down as the user growth simmered down. If we look at what we have seen so far this year (see graph), it’s gone from 2% to 1%, and it fluctuated in that range, so the average this year is 1.6% of the accounts that were created any given month and being kicked off for misuse or inappropriate activities. And again, these are only the ones that were identified successfully.
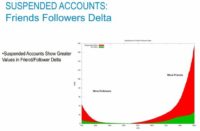
Paul Judge: We wanted to better understand what are the behaviors and properties of Twitter accounts that get suspended. One of the things that we looked at was the Friends-Followers Delta (see graph). The Friends-Followers Delta is reflecting the difference between the number of people you follow and the people following you. The thing that we noticed is that the attackers are using pretty aggressive recruitment activity to get a higher number of followers, so their delta is higher. What you see here in the green space is the delta for legitimate accounts: on either side, people that have more followers and people that have more friends. But for the suspended accounts, you see a very much higher delta because either they’ve successfully created a higher number of followers or they are still in the process of following people, so those people can follow them back, and so they have a higher number of friends. That’s a pretty interesting attribute to use, to get some separation.

The other thing that we looked at to get some separation is this number that we call the Tweet Number. And the Tweet Number is pretty simple math: how many days you have been on the network, and we divided that by how many tweets you have sent. So it’s basically on average how many tweets you’ve sent since you joined Twitter. For example, my Tweet Number happens to be 1.8. I think Dave’s is 3.2. So it’s interesting, I know some friends, a couple of guys in the room, whose Tweet number is 40. You know, 40 is like tweeting every 15 minutes in a work day. It’s like – wow, it’s pretty high, you kinda annoy. But then there are some other accounts, if you look on this (see diagram), that are actually tweeting 100 times a day, but it’s only 0.19% of the population. Seems like okay, it’s only a small number of people, 0.19% of population. But what happens, if you think of that 0.19% of 50 million users, we’re talking about a couple of hundred thousand users. Now, when you’re talking about a couple of hundred thousand users tweeting at least 100 times a day, you’re talking about 19 million tweets out of 50 million users, you’re talking about 38%of all the traffic on Twitter. So over the third of the traffic on Twitter is being generated by this 0.19% of the population. We thought this was a pretty interesting attribute.
So, what we did from there is we kind of really looked into how we can begin to build some level of reputation by coupling these features together, coupling together this Friends-Followers Delta along with the Tweet Number. And as we did it, we got some interesting graph of separation, interesting clusters of user types. David will step us through some of those.
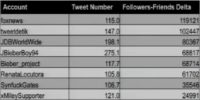
David Maynor: So this is the Friends-Followers Delta on a positive side, which means there are generally a lot more people following them than they are following, and the usual suspects of that are foxnews (see table). Number 4 and number 5 are that Bieber kid. And the xMileySupporter also makes it on the top list there.

When you go from the Friends-Followers Delta, you know, like 119,000 down to 4000 or 5000 range (see table), you get people like iSkeetThenTweet, which I don’t know what that means. LiveBloggerJobs – it’s more like localized recruitment kind of things, I don’t know what the iSkeetThenTweet is recruiting, but it looks like the rest is stuff here is financial news and that kind of stuff.

And then the lower you go and closer to zero, you’re starting to see some scammers (see table), like the Moneywholesale, you know, well nobody uses the Moneywholesale, none that I’m aware of, but if you do, I’d like to know about this. And LA_Restaurants – there is not really no other good place to eat in LA except for Pinks.

So, when you get the negative numbers, you definitely find scammers (see table), like, you know instantbiztips, Cam4porn (I don’t know what that one is), tweetstockstips, and this www.365buying.com. So the lower, the further down, the more distinct the scammers become.
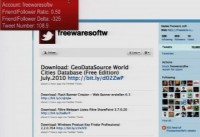
This is an example (see screenshot), this is the site of a Twitter follower, he’s got a Friends-Followers Delta of -325, but he’s got a Tweet Number of 108.9, which means he is basically tweeting all the time. But no one is really following. And if you take a look at it and if you go to the site, it’s a free software site where you can download stuff for different activities. But if you take a look at the Google Diagnostic Page, it becomes more clear what it actually is – well, 10 Trojans, 4 exploits, 1 scripting exploit in the last 90 days that Google scanned it. So obviously, it’s not a very good site.
And with that, we are going to the top 10 search terms used by malware. This is actually the money shovel part of the presentation.
Paul Judge: So we looked at what’s going on different search engines, we looked at what’s happening on Google, Bing, Yahoo!, we drilled into Twitter a little bit more to see how the attackers are creating fake accounts, you know, we saw that over 70% of the accounts on there really aren’t using the network. We looked at types of categories that malware likes and ones that malware doesn’t like. And so we learned a lot about how this is happening, the scale of the search engine optimization attacks. We’ve talked about our categories, we’ve talked about the fact that we did this in 57 days, we saw over 25,000 search terms, 5 million results.
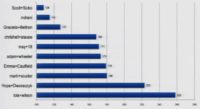
But out of those 25,000 search terms, there are some that are more popular than others. There are some that are kind of used more by attackers. And so we want to understand what those search terms are, which one are being used. It’s a very wide set of things. On the list we had a couple of NFL players, we had some politicians, some actresses (see image).
 If you look at one of the guys on the list, the guy’s name is Adam Wheeler (see photo). Anybody heard of Adam Wheeler? It’s a guy who cheated his way into Harvard. He forged his transcripts and got Harvard full scholarship, and now he is facing about 20 charges: identity fraud, forgery, larceny etc. So the poor guy is gonna get into some trouble now. So as this news broke, he became one of the top.
 So look at the top search term, it was a lady named Lois Wilson. Lois Wilson and her husband started Alcoholics Anonymous. The reason she was trending is on April 24th, there was a movie that came up that told her life story. And if you look at all the results on malware that we found, she was the top search result that was being used. You know, this is Defcon, that’s not a very interesting term that stays in the top of the list. So we went to our scientific pull, and we said: “Hm, let’s really understand what’s our favorite search term that was used by malware, kinda what’s the viewers’ choice?”

Paul Judge: What we came up with is if you look at the number 2 search term used by malware, the term is Hope Dworaczyk. Hope is a model, actress, TV personality. She was the Playmate of the month in April 2009; she was on the cover with Seth Rogen. In the last month, she was named ‘Playmate of the Year’. So if you look back at the covers, Seth is seen having fun with the fan there.
We looked at the issue in June, it was interesting because it was actually a 3D photo shoot (see cover below). So, you know, you got the magazine, you got the 3D glasses, so I was sitting and thinking whether we could get enough 3D glasses for the room. And we cannot get enough 3D glasses, but what we are able to do is have Hope come and join us as a viewers’ choice of the best reason to click on malware in 2010. So I would like to introduce Hope.
Hope Dworaczyk: Hello, thank you for having me.

Paul Judge: So thanks for coming up, thanks for stopping by Vegas, thanks for stopping by Defcon. Have you been to Defcon before?
Hope Dworaczyk: I’ve never been here, but I’ve been told to turn my WiFi off and my Bluetooth, I don’t know if that’s right, but it’s off.
Paul Judge: Obviously, you’ve been busy, had a lot of success, your name is all over the place. And what we found is that the attackers are using your name. Did you know about this all, and what do you think about it?
Hope Dworaczyk: Everybody googles themselves, first of all. So, of course I’ve googled myself, and I’ve seen my name with things I know I haven’t been a part of or haven’t done. So that was not news to me, I guess, but the part where I was part of viruses or any of this stuff – that was news to me. So, when I got a call to come in, I was more interested, and I wanted to know why or find out more about it.
Paul Judge: Interesting! So, you know, one thing we looked up is you use Twitter. Your Tweet Number happens to be 1.03, in case you don’t know that.
Hope Dworaczyk: 1.03 means what?
Paul Judge: 1.03 means you tweet on average 1.03 times a day.
Hope Dworaczyk: Okay, cool.
Paul Judge: Just in case you want to know that.
Hope Dworaczyk: Sometimes I tweet, like, 7 times in a day, or I might go, like, 2 weeks without doing it. So it’s different all the time.
Paul Judge: So you’ve been on Twitter for a while now. You have this verified account. You have over 10,000 followers. You know, we’re talking about how the attackers are using social media. How are you using it? Has it changed your life at all? What do you think about the technology at all?
Hope Dworaczyk: I think the coolest thing about Twitter or having a Facebook account, mainly, is that you can communicate with people instantly. Last night I took my grandmother who told me to pose for Playboy when I was questioned whether I should do it or not. I took her to Playboy to meet Hugh Hefner. So I tweeted that this morning, and I directly go to my replies and I can read, you know, whoever is replying immediately. It’s really cool to read it and then sometimes reply or send a direct message. So that’s what I use it for, to communicate with people that normally can’t reach me and I can’t normally reach.
Paul Judge: Wait a second, we didn’t talk about that beforehand. So your grandmother told you to pose, and then you took your grandmother to meet Hefner last night?
Hope Dworaczyk: It’s really a funny story. I am from Texas, a small town in Texas. And when I was approached to pose for Playboy, I was scared to death to tell anybody. So I put it off for months and I didn’t tell anybody, like – hey, they want me to be on the cover with Seth Rogen from ‘Knocked Up’. I didn’t tell anybody, I was just leaving it on the table. And the first person I told was my nanna. And nanna said: “If I was your age and I had the opportunity, I’d go for it.” So when she visited me in LA last week, last night was her last night there, and so I took her out to meet Hef.
David Maynor: Can I ask a question? I just wanna ask a question everyone wants to know here. So if you are a computer hacker, and you are in a casino, and you see a Playmate at the bar, how do you approach her?
Hope Dworaczyk: Probably start talking that you can hack her site, because we are kind of into that. You tell us you could do it but you won’t because you think we’re nice and sweet, because I really don’t want any of my stuff hacked.
Paul Judge: Got it. So the best way to impress is just not to hack her site, because she’ll say, like: “When I get go home, is my site gonna be down?”
So with that, we’ll kind wrap our session. Thanks again, here we have a little token for you to remember our session – best excuse to click on malware in 2010.
We actually have a couple of minutes left, any questions for us? So the question was: any recommendations for the best defense for these attacks. Most of these things, 98% of them, were things which were flagged by existing technology, so URL filtering, antivirus signatures, malware lookup databases. The good news is, as long as you are using some protection and applying it to any part of our life as appropriate, you would actually be defended from 98% of these things.
David Maynor: The biggest problem – and it’s hard to say it as a security researcher – is we spend more time looking for the problem than the solution, and most of the solution just seems to be to train people better, but that’s not really a scope of solution.
Paul Judge: Another question? So the question was about Paul Vixie creating a reputation site and being sued. It’s always kind of interesting see the attackers use the legal system against people that are trying to defend, so we had to deal with things along those lines certainly, but it’s kind of part of the risk of the business. So with that, I think I’ll wrap.


