 As the Principal on Verizon’s RISK team, Jay Jacobs utilizes the VERIS (Vocabulary for Event Recording and Incident Sharing) framework to collect, analyze and deliver risk data to the information security industry. He is a contributor and co-author of Verizon’s Data Breach Investigations Report series. Jay is a co-founder of the Society of Information Risk Analysts and currently serves on the organization’s board of directors. He is also one of the primary authors of the OpenPERT project, an open-source Excel plug-in for risk analysis. He is an active blogger as well as a published author and a co-host on the Risk Science podcast.
– Chinese espionage is a buzzword now. Have members of the RISK team communicated with or been approached by any Chinese entity regarding this matter? Will we see any Chinese contributors to DBIR in the future?
– I am not sure I’d label it as a buzzword, we were able to collect and analyze 120 cases that we were able to tie back to threat actors within China and the tactics used and patience displayed by the attackers was very real and significant to the victims. We have not been approached by any official Chinese entity about this, but we have reached out to the Chinese CERT organization to discuss participation in the future. We definitely are not exposed to all the breaches that occur and adding more perspectives and partners will help increase the confidence in our data.
– The number of your contributors increased to 19 last year. Can we attribute it to your active recruiting or did new contributors offer their help themselves?
– There is a mix, but we are always looking for more partners and actively reaching out to organizations.
– What can we anticipate next year in terms of new types of contributors, new countries?
– It’s hard to say, in the 2012 report we had 5 partners and we increased that to 19 for the 2013 report. If things go well we’d like to continue expanding our partner list and we are actively pursuing partners outside of the US to improve international representation.
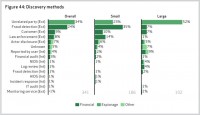
– Figure 44 shows the breakdown of discovery method. Unfortunately we do not record a layer of detail beneath what you see in the report. ISPs were not well represented.
– What about attracting more ISPs to you report?
– We haven’t worked directly with ISPs concerning specific breach data but it’d be something we’d be interested in pursuing. We are very focused on gathering data to represent the threat landscape and ISPs certainly see their fair share.
– Why don’t we see any NGO or NPO coverage in your report?
– We use the NAICS system to classify industry and they do not distinguish between for or non-profit entities. Though, we generally don’t see a lot of non-profit entities in our data which may be in part to our collection method more than the non-profits themselves.
– Is it possible and are you planning to collect data on successes?
– I assume success means breaches that are stopped. We do have quite a few of these cases in our data. Organizations know something happened and bring in law enforcement or a forensic investigator. Typically what they’ll find is a lack of evidence of a successful breach, but they very rarely find evidence that the attacker failed. At that point attributing a cause or correlating why the defender may have been successful becomes a challenge. But this is something we are looking into collecting more data at least internally with our investigators.
A follow-up on our interview where Verizon’s Jay Jacobs explains reasons for data breach detection failures, financial industry’s security problems, and more.
– For the next year, are you planning to present the results in different ways, change or add segmentation? What exactly?
– It’s hard to say at this point, we’ve greatly improved our data management back-end, which enables some interesting perspective and analysis. One thing that we’re attempting to pick out is patterns. We’d like to focus more on the patterns we see in particular industries. One huge lesson we’re able to pull from our data is that not all breaches are equal and not every organization has the same threat landscape. Being able to pull out the differences and similarities should help inform decisions for those organizations. But we won’t know for sure how we’ll present the data until we can gather it and then see what kind of analysis the data would support.
– What was the most valuable feedback you received this year on your report?
– We’ve been doing this for a number of years and the feedback from the community is always an important part of the process. We get quite a range of feedback too, for example, some people don’t like that we include physical tampering (with ATM machines) in the data because there are very different types of attacks, while others send words of thanks for including that in the research. We collect the feedback and will review it as we go through the analysis next year.
– We see a lot of organizations fail to detect breaches. What do you see to be the main reason: no monitoring, bad monitoring, tools do not work?
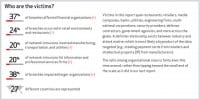

– We estimate that just under 4 out of 5 system attacks in 2012 (involving malware or hacking techniques) targets user credentials at some point in the chain of events. Implementing two-factor authentication would have forced the attacker to adapt or leave. The abuse of credentials is definitely a huge pattern across industries and threat actors and has the greatest potential to force the attackers to change their approach.
– Excluding ATM attacks, what are the most important and/or interesting numbers regarding attacks on banks?
– There are two interesting differences about the financial industry. First is the large proportion of web-based attacks, attacks at and through the web applications are a much larger proportion in the financial industry than in other industries. The other trend we see is insider misuse. While the attacks we analyze show a much larger proportion of external attackers to internal, we see a larger proportion of internal misuse in the financial sector than others. Along with that we see quite a bit of collusion, where an external actor will solicit help or bribe an employee for their cooperation.
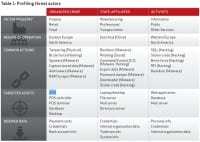
– On the rise over the last few years, yes. Though we saw a decline in the amount of records they stole in 2012, we did see a sharp increase in their denial-of-service attacks. What is interesting about activism-related attacks is that they have a much different set of tactics than other attack communities. Aside from the DDoS, they favor the web applications and target data that will grab attention, which is usually usernames/passwords or related information like that.
– Lost and stolen devices were not counted, do you have any numbers on such devices?
– Our report focused on confirmed breaches of data confidentiality. While lost laptops definitely lose the data, we can only suspect if the confidentiality of the data on the device is breached. In our larger data set (not covered in depth in the report) is that lost devices and misaddressed envelopes represent a huge proportion of the incidents. We see this more where forced reporting of incidents is required.
– In several parts of your report you compare stats year-to-year, how accurate is this as the sources and data set are different every year?
– We talk about this in the report, but we should try to keep year-to-year comparisons to a minimum. Given the change in the sources, we cannot directly compare year-over-year data sets to each other. But there is a natural curiosity about the changes over the years and if we read them as “this is what the data showed last year, and this is what it showed this year”, we can make the comparison. The challenge comes when people say “there was an x% increase from last year”. We shouldn’t jump to that conclusion.
– Any incident may have several attack methods. What percentage of breaches involved multiple threat actions and which exactly? How useful is this type of statistics?
– I did an Appendix in the 2012 DBIR that attempted to dissect this. Roughly two-thirds of the breaches involved more than one threat action in that analysis. Understanding the event chain is an important component of defending. If we can’t stop the attacker at the perimeter, understanding the event chain and the second threat action, third and so on, can help build the defense in depth.


