 During his USENIX talk “How Does Your Password Measure Up? The Effect of Strength Meters on Password Creation” Blase Ur, computer security and privacy researcher with Carnegie Mellon University, presents a thorough study of password strength meters in terms of their effect on password creation process.
Hi, I’m Blase Ur from Carnegie Mellon University, and I’ll be telling you about password meters. We look at password meters as any kind of visual feedback of password strength given during the creation time of the password.

So, for instance, if I go to PayPal and start making an account, they’ll ask me to make a password. And as I start making a password, comes out and gives me some little orange indicator and it’s telling me: “Your password is just fair” (see left-hand image). And the idea of these password meters is to encourage users to create stronger passwords.
Password meters are widely used: sites from Google to WordPress to USENIX’s own site have password meters for when you’re making an account. The open question here is: “Well, as community, we don’t really know what, if anything, these password meters do?”
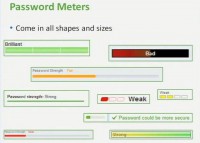
Furthermore, password meters come in all different shapes and sizes (see right-hand image), so these are just a couple of screen grabs from Alexa’s Top 100 global websites. You can see there’s really a wide variety of visual appearances of password meters. Is one of these better than the others? Are some just outright not very good? So, we really wanted to look into this.
In particular, our two main research questions were:
1) How do password meters affect the composition, guessability, creation process, and memorability of passwords as an addition to user sentiment?
2) What elements of meter design are important?
So, we present the first large-scale experiment on how the visual and scoring aspects of meters affect password properties.
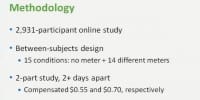
To this end we conducted a 2,931-participant online study with the between-subjects design. So, each participant was assigned to one of 15 conditions specifying what they would see. On one condition, participants saw no meter whatsoever when they created their password, and on the other 14 conditions they saw one of these 14 different meters we created, which I’ll show you in a few moments. The study took place in two parts two or more days apart, and participants were compensated 55 cents and 70 cents, respectively, for these two parts.
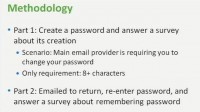
In part 1 we asked participants to create a password and then to answer a survey about its creation. And the scenario we gave them for why they are creating a password is to imagine that their main email provider is requiring them to change their password. And this particular scenario’s worked well for our group in the previous work. The only requirement we gave them about this password, told them or enforced, was that the password had to have 8 or more characters; that’s it.
Then, 48 hours after part 1, participants received an email to return to the second part of the study, in which they would re-enter the password and then answer a survey about how they remembered the password, or, as the case may be, didn’t remember the password.
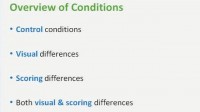
Now I’d like to go into our 15 different conditions. The easiest way to think about our 15 different conditions is actually in 4 main groups. First: our control conditions, and I’ll go through all of these in detail in a moment. Then we had conditions with visual differences, some with scoring differences, and some with both visual and scoring differences.

Let me start with our two control conditions, which are the conditions to which we compared all of our others. Our first control was having no meter, that is, no feedback on password strength. And our second control condition was having a baseline meter, a standard password meter.
And we created a standard password meter, this baseline, based on meters used in the wild, on Alexa’s top 100 global websites. I’ll show you exactly how this meter looks and works in a few moments. We designed this meter so that a password consisting of 8 lowercase letters – that is essentially minimally meeting our stated requirements – would only fill one-third of the meter.

Higher scores were possible in two main ways: first, having a longer password, so, in many of our conditions having a password with 16 characters, no further restrictions, would fill the password meter. Secondly, you can have a password with more different character classes: so, for instance, in many of our conditions an 8-character password with an uppercase letter, lowercase letter, digit, and symbol, would also fill the meter.
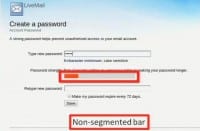
Here is how our baseline password meter looked (see left-hand image): this is the page on which participants created their passwords, it’s based on Windows Live’s account creation page. So, they start typing in the password, and you’ll notice there is a visual bar, and this bar is non-segmented, that is, the bar could be filled to any degree, and, basically, after every key press there could be a big change or a small change in the bar.
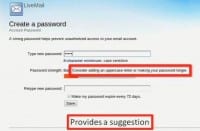
You’ll also notice, above the bar we have a word corresponding to how much of the bar is filled. And this word goes from bad to poor, to fair, to good, and then to excellent. Next to the word we have a suggestion for making the password stronger. For instance: consider adding an uppercase letter or making your password longer (see right-hand image).

So, to do a little bit more, we perform a dictionary check against OpenWall’s mangled wordlist, which is a cracking dictionary; and if it’s in this cracking dictionary, we tell them: your password is in our dictionary of common passwords (see left-hand image).

And you’ll notice by now: the meter’s been changing color. It gradually changes from red to orange, to yellow, and eventually to green, to the point where they’ll eventually fill up the meter and receive the word “excellent” (see right-hand image).
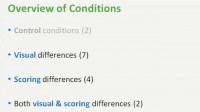
So, I just showed you a number of different features, and we, of course, wanted to know what each of these features is contributing. All of our other conditions were based on and varied from our baseline meter. In particular, we had 7 different conditions that varied from the baseline meter only in visual appearance; the scoring was the same as in the baseline meter. We had 4 conditions in which we kept the visual appearance the same, but varied the scoring from our baseline meter (see right-hand image). And then 2 conditions in which both visual and scoring elements were different than in the baseline. Now we’ll go through all these in turn.
With our visual differences – I’ll keep our baseline meter on top just for reference, and I’ll show our other visual conditions below it. Just as a reminder, no participants saw it like this. I’m also showing what I’m typing in plain text, and again, that’s not how our participants saw it in the study.
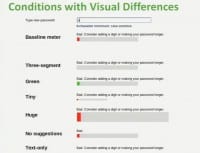
So, what are the things that we wanted to look for with visual differences? (See left-hand image) Does it make a difference whether the meter is continuous or only has a few distinct segments? So we had one with three distinct segments that were either filled or unfilled. Does having the color change make a difference? So we had a meter that was always green rather than changing from red to green. Well, does the size make a difference? So we had a tiny meter – I guess, the gymnast-sized meter, and a huge meter, a sumo wrestler-sized meter. That’s a really big meter. The suggestions we were giving them – did they make a difference? So on one condition we took the suggestions away. And finally, does the bar make a difference? So we had a condition where we took the bar away and had a text-only meter.
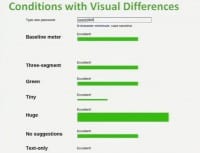
Notice: as we type in, they’re all pretty much going in lockstep, and they all fill up at the same time.
These were our conditions with visual differences, with one exception – there’s one more I’ve left out. We said: “Well, a lot of these meters we see have bars, and that’s what we observed in the wild. Does having a bar actually matter? Could we have some different visual metaphor?”

And so we wanted to come up with something a little ridiculous, and we decided: “What’s more ridiculous than a dancing bunny?” So we have a dancing bunny meter. The stronger your password, the faster Bugs Bunny dances. And so we start typing, he is starting to pick up speed, and then as you keep going, he’s just kind of going crazy. So that’s out bunny meter (see left-hand image).
Our next category deals with scoring differences – and again, the baseline meter I’ll keep on top here for reference. There’re two main kinds of ideas we wanted to check. First, what if we just showed them always a lower score than in the baseline? So we had two conditions: half-score, in which we always showed half the score as in the baseline meter, and then one-third-score, in which, as you might guess, we always showed one-third the score as in the baseline meter.
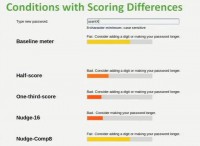
Next we wanted to test: what if we just always push participants towards a particular policy? Either, in the first case, having always longer passwords, pushing them towards 16 characters or more, or, in the second case, pushing them towards more complex passwords with multiple character classes.
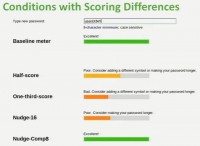
And you’ll notice, as we start typing in, at this point the baseline meter is already reading Excellent, half-score meter’s saying Poor, the one-third-score meter is saying Bad (see left-hand image). We keep going, keep going; roughly, about 30-character-long passwords would fill the half-score meter, and to fill the one-third-score meter you’d need about a 40-character password.
Then our final group of conditions were those that differed both visually and in scoring elements from our baseline meter. Particularly, visually they actually lacked a visual component: we took away the bar and had text-only conditions. In the first case, standard text; and in the second case, boldface text.
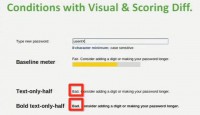
We also changed the scoring; we used the same scoring as in the half-score meter, so we always showed half the score as in the baseline. So, for instance, the text-only meters right now are saying Bad, whereas the baseline meter is saying Fair (right-hand image). Similarly, close to about 30-character-long passwords would finally get a score Excellent from these half-score and bold text-only half-score meters.
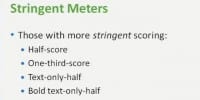
Four of the conditions I’ve already shown to you we gave a special name for, we called these our Stringent meters (see left-hand image), that is, those with more stringent scoring who always received a lower score than in the baseline meter. And so, from the scoring grouping it was half-score and one-third-score – these were the two that had visual bars, and then this final group of conditions I just showed you are text-only half-score and bold text-only half-score conditions. So, throughout our results I’ll refer collectively to these four meters as our stringent meters.

Before I jump into our results, I’ll tell you a little bit about our participants. We had 2,931 of them recruited on Amazon’s Mechanical Turk crowdsourcing service. Our participants were biased male: 63% male; and also biased technical: 40% of our participants said they had a degree or job in IT, computer science, or a related field. Participants ranged from 18 to 74 years old and hailed from 96 different countries, with 42% of our participants from India and 32% from the US.

For our results section I’ll go through 5 main metrics, and I’ll just give you some highlights for each of these metrics; there is a lot more in the paper. First I’ll talk about composition of passwords participants created; then about the guessability of these passwords, then the password creation process, memorability of the passwords, and finally, participants’ sentiment. And as I go through, I’ll tell you a little bit more about why we chose these metrics.
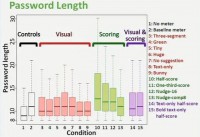
So, for the first metric results today I want to just highlight password length (see right-hand image). Here you can see: on the Y axis we have password length, and on the X axis are different conditions. And we’ve color coded the different groups I just presented to you: our controls, ones with visual differences, ones with scoring differences, and then ones with both visual and scoring differences.
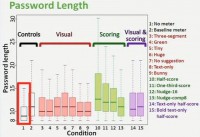
The leftmost box over there (see left-hand image), that’s our no meter condition, so, no feedback. And our other 14 conditions are those that have meters. And what you’ll notice is that conditions with meters generally have longer passwords; in fact, in 13 of these 14 conditions with meters, the passwords created were statistically significantly longer than those created without a meter.
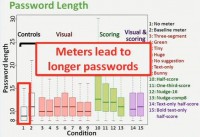
In particular you might see some of the green boxes jumping off a little bit, and those are our half-score and one-third-score conditions, the two stringent meters with visual bars. What we saw from this is – with the meter participants created longer passwords. In security community, people are creating slightly different passwords here, but the question of importance to us is whether they are creating more secure passwords.
Our next metric was guessability of passwords, that is, how many guesses would it take to crack the password they created, and our threat model was an offline attack. It’s happened all too often in recent years: databases compromised, even if passwords are correctly salted in hash, someone wants to try and guess them. The brute-force way of going about this would be to maybe start with guessing 8 A’s in a row, followed by 7 A’s and a B. Perhaps a smarter way to do this would be to guess passwords in order of their likelihood: so, maybe, the first guess might be ‘12345678’, the next guess might be ‘password’.
And there’s this latter, the smarter approach that we used to evaluate the strength, or the guessability, of passwords. In particular, we used a cracking algorithm proposed at Oakland three years ago, as implemented in a Guess number calculator – essentially, a giant lookup table that was presented at this year’s Oakland.
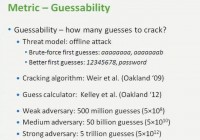
For analysis we looked at what we termed “three different adversaries”, we have what we call our Weak Adversary, who makes 500 million guesses of passwords; our Medium Adversary, who makes 50 billion guesses, and our Strong Adversary, who makes 5 trillion guesses. And to give you some sense of how this number of guesses translates to actual resources, and these will be really rough numbers. Let’s say if we had about 100 CPU cores running at pretty much full utilization for about 2 weeks, we could make about 5 trillion guesses, and that’s, of course, very hardware implementation and hashing algorithm dependent.
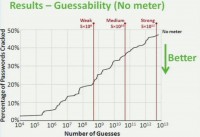
So, our guessability I’ll present with the following graph (see left-hand image); each condition will be a line on the graph. On the X axis we have the number of guesses on the algorithmic scale, and on the Y axis we have the percentage of passwords cracked by that guess number in each condition. So right now I just have no meter up, and so, for instance, here our medium adversary would have guessed roughly 35% of the passwords created without a meter.
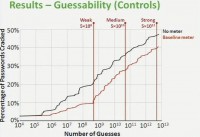
As I introduced the rest of the conditions, the lower on the graph is better; lower is more resistant to cracking. So, first, let me bring in the other control condition. Here is our baseline meter, that’s the red line (see right-hand graph), and you’ll see it’s a bit lower, it’s a bit seemingly more resistant to cracking. However, this difference is not statistically significant.
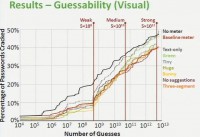
Now let me bring in all the meters that differed visually from the baseline (left-hand image), and I’ll flash this back and forth a few times. What you see is it’s not much different than our control conditions. In particular, none of these conditions were statistically significantly different than either our controls at all three adversaries. What we see is that the visual changes don’t significantly increase resistance to guessing.
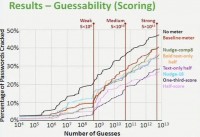
Let me take these away, and now I’ll bring in the rest of our conditions, those differing in scoring, and those differing both visually and in scoring. Again, I’ll flash it a few times compared to our controls. And what we see here is that it’s a little bit lower on the graph; that’s better, it’s more resistant to cracking (see right-hand image).
And in particular we have these two conditions, half-score and one-third-score, those are the stringent meters with visual bars. In those conditions passwords participants created were statistically significantly more resistant to a guessing attack than those created without a meter, and it was actually also lower than baseline, but that difference was not statistically significant. So, what we’re seeing here is that the stringent meters with visual bars are increasing resistance to guessing.
Let’s move on to the password creation process. In particular, I’ll highlight the time it took the participants to create a password, and also how participants changed their mind during creation. Of course, we captured all their keystrokes to do this analysis.
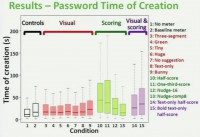
Here (see right-hand image) is the box plot of time of creation: the Y axis is the time of creation in seconds, and on the X axis you see the conditions, again, color coded for the groups. And what we see here is we see a couple of conditions that are really sticking out.
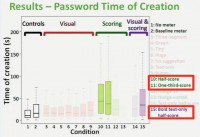
In particular, compared to our control conditions, we see 3 of our 4 different stringent meters are much higher – that is, participants in those conditions spent more time creating the password (see left-hand image). So of course, our next question might be: what are they doing during that time? Are they just sitting there wondering why the meter is telling them their password is not very good, or are they doing something else?
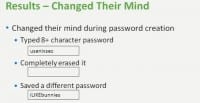
And so, we looked at how participants changed their mind during the creation process. The way we defined a participant to have changed his or her mind was the following: first they had to type a password of 8 or more characters; they created a password that met the minimum requirements, the state of requirements to proceed. And then they completely erased it and went back to step 1. And then they typed in the password and eventually saved something that was different from what they had originally typed. And so, participants who did this, we said they changed their mind.
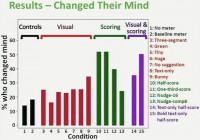
Here is the graph of the percentage of participants in each condition who changed their mind (see left-hand image). What you see here is, if we look at our two control conditions, between 10% and 20% of participants in those conditions changed their mind during the password creation process.
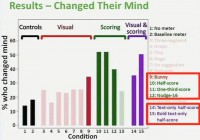
However, participants in all four stringent conditions, as well as who saw the dancing bunny or the condition in which we pushed them only towards longer passwords, changed their mind at a higher rate. So, for instance, in 3 out of the 4 stringent conditions – half-score, one-third-score, and our bold text-only half-score condition – over half of participants changed their mind by our definition during the password creation process (see graph to the right). So, what we’re seeing here is that meters lead people to change their mind and really do something substantially different during the creation process.
So, I’ve presented a bunch of results about what passwords look like, and we found that with the stringent meters, with visual bars, participants created passwords that were harder to guess. Of course, if those passwords are also harder for participants to remember, what have we actually achieved? So we looked at a number of memorability metrics. For instance, our participants were able to successfully log in with their password about 5 minutes after they created it, and also, 2 or more days later, when they return to the second part of the study.
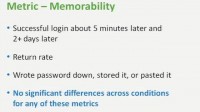
Participants returned for the second part of the study; we hypothesized that if a participant created a ridiculous password that they had no chance of remembering, maybe they wouldn’t even bother coming back for part 2. Also we looked at the proportion of participants who answered in our survey that they wrote their password down or stored it electronically, or whom we observed pasting in their password. And so, what we found here is not much: we found no significant differences across conditions for any of these memorability metrics.
This was both surprising and also good. We expected, while participants are making longer passwords, participants with the stringent meters and visual bars are making harder-to-guess passwords, surely, they must not be able to remember these, but that’s not what we found. We didn’t find significant differences across conditions, which is a good thing.
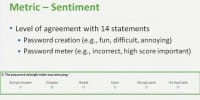
So, finally, when we talk about participants’ sentiment: in addition to an open-ended response, participants rated their level of agreement with 14 different statements about both password creation – such as is it fun, difficult, annoying to create a password in this scenario – and also about the password meter, such as yes/no, agree/disagree that the meter gives me an incorrect score, or that’s important to me that my password gets a high score from the meter. And responses were given on a 5-point scale, from Strongly Disagree to Strongly Agree (see image above).
Where we found the biggest differences in our sentiment results was with the stringent meters. We found that participants found stringent meters a bit more annoying than the non-stringent meters, and I’ll go into more detail in a moment with this result. And we also found that participants believed the stringent meters to have violated their expectations. They basically didn’t think these meters were correct; they found it actually less important that the meter give them a high score.

Just to give you a little bit more of the concrete sense of this, let’s look at participants’ responses to “Password strength meter was annoying” (see images). Each condition will be represented by a horizontal bar. On the left-hand side in the red you see the participants who agreed with the statement: “Yes, the meter was annoying”,
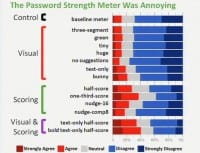
which in this case was about 13%; and in the right-hand side in the two shades of blue, see those who disagreed or strongly disagreed, which in this case was the majority of participants. In the middle in grey you see those who were neutral.
Again, I’ll bring our conditions in our different groupings (see left-hand image). So, if you look at the visual groupings, you really see not much difference from the baseline meter; none of these conditions was significantly different than the baseline.
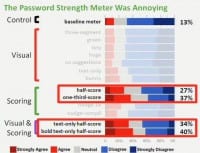
Where we do see differences is with the stringent meters. So, for instance, while 13% of participants who saw the baseline meter agreed: “Yes, the meter is annoying”, between 27% and 40% of participants who saw the stringent meters agreed: “Yes, the meter is annoying” (see image).
So, this tells us: first of all, yes, people seem to be paying attention to the meters, and while you might say it’s not necessarily a great thing for them to be a little bit more annoyed, it’s still a minority of people, and by our other metrics they still seem to remember their passwords.
I’d like to conclude with some of our main takeaways. We came into this study with kind of the overriding question of “Do meters do anything?” And what we did find is yes, meters do matter. We found meters lead to longer passwords; in the case of our stringer meters – even longer passwords.
Of course, passwords are different. Are they actually more secure? In particular, our stringent meters led participants to create passwords that were harder to guess. However, we didn’t observe significant differences in memorability. So, participants are creating more secure passwords, but they still seem to be able to remember them.
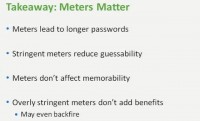
You might be saying: ok, well, now we should just make all of our meters super stringent, and no one will have a bad password. What we found though is that overly stringent meters don’t seem to add benefits. So, if we take our one-third-score meter, which was our most stringent meter, and compare to, say, our half-score meter, we didn’t find any extra security benefits, but we did find participants to be more annoyed and actually to trust the meter less, to say “It’s not as important that it gives me a high score”. So, that may even backfire.
So, what makes meters matter? The two important features that we found were:
1. The stringency of scoring. It was our stringent meters that performed best, and this is particularly interesting, since the stringent meters aren’t what we observed in the wild. It was our baseline meter that most closely represented what was in the wild, and to really get these extra benefits we could have more stringent meters.

2. Having a visual component seemed to be important. Our text-only conditions, both with normal and half-scoring, didn’t perform as well.
However, what we found to be our less important features were the visual elements: the color, the segmentation of the meter, the size of the meter. This was surprising: we had this gigantic meter, and that didn’t seem to be any better than having a really tiny meter. And it also didn’t seem to be really important whether we had a bar or we had a meter with lots of bunnyness. So, thank you very much and I’ll be happy to take questions.
Question: I really liked the study and I applaud your large sample size. I’m wondering if you had any way of measuring user tendency to abandon trying to create a password. So the thing that occurred to me with stringency is if they find it more annoying, are they more likely to just give up? Do you have any way to measure that?
Answer: We talked about this a bit in the paper, about the idea of giving up, exactly. The first comment I would make is that as compared to something, say, password policies, meter is actually just a suggestion, it’s not a requirement. The meter could have said your password is awful, and you could still proceed, which is the case with meters.
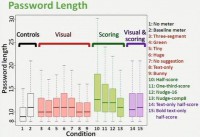
However, we did look at participant tendencies to try and fill the meter or reach milestones or give up, and just a really quick way to look at this is if you look at the password length, you could see that baseline meter is some length; half-score meter – people should make longer passwords, one-third-score meter – they should make even longer passwords. But that’s actually not what we found: condition #10, the leftmost green one, was our half-score meter, and condition #11 was our one-third-score meter (see graph). And it’s actually half-score where we seem to actually have the longest passwords.
This was really mirrored in our sentiment results: with the one-third-score meter we found participants less likely to say: “It’s important that I get a high score”, so exactly, you push them a lot – and they indeed give up.
Question: It seems odd that your guessability metrics took into account dictionary attacks, implicitly in the way that you’re doing them, but none of your meters complained about dictionary words in the passwords?
Answer: So, we did have in the meters the notice that if it was in the OpenWall mangled wordlist, the cracking dictionary, then we did tell them: “Your password is in our dictionary of common passwords”. In some sense, it’s what feedback do you give to people, then how do you evaluate the security of passwords. The algorithm that we used is as a training set, then from that training set computers compute the order likelihood of guesses. There are many ways to evaluate it, and actually our choice of a guessability metric was motivated by some of our past work, our group’s paper at Oakland this year, in which we compared a bunch of different guessability metrics and found this to perform the best.
Question: Great work! My only question is: between the enforced 8-character minimum and the fact that participants likely knew that passwords were the subject of this study, if you could comment at all on ecological validity?
 Answer: Oh yes, absolutely. Thank you for bringing up the ecological validity, which in any user study is always very important. I think there’re arguments from both sides for ecological validity here. So you can say: “Ok, participants knew they were taking part in the study about passwords, perhaps they paid a lot more attention to this”, – in that case this would absolutely be kind of an upper bound on the participants’ attention.
On the other hand, if we take a step back and say: “All they had to do is create an 8-character password and move on, and then they still get paid, whether they create an 8-character password or 40-character password, and they’re not actually protecting any high-value account”. In that sense it was kind of surprising to us: like, why would anyone actually pay attention to the meter?
And just to take your point on the ecological validity, which is, of course, very important, and expand a little bit further, the ideal circumstance for this study would have been if I were able to control a major website’s account creation page and run an experimental study – that would have been really cool. Coming into this, we as a community didn’t really have that much sense of what, if anything, these meters do, and what we have is a kind of progress, and I think there’s actually a lot of room for further studies even focusing more on ecological validity in this space to really add to this work.


pls what can i do to reopen my yahoo mail that was hack body someone. The hacker has change everything including questions which yahoo will when somebody forgot in password or id. Pls can you assist me. Thanks.