
 Black Hat Europe 2012 conference guest Chris Wysopal, the CTO and Co-founder of Veracode, presents his research on the different sorts of prevalent and potentially exploitable web application vulnerabilities derived from the large data set that was processed by his company.
I’m Chris Wysopal, CTO and Co-founder of Veracode, and today I am going to be talking about application security and bring a lot of data to bear to get an understanding of the state of what is going on there with software developers all over the world.
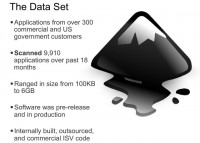
The data set that I have comes from Veracode Service. We’ve scanned almost 10,000 applications over the last 18 months, and the data comes from our static analysis of the software that our customers sent to us to test.
The definition of an application is pretty vague, I’ve seen a lot of arguments about web applications, what’s a web application, because it’s certainly not a web site, there could be lots of web applications running behind a domain. It’s easier when it’s a pack, a piece of software you install, but in general it varies hugely.
We’ve looked at applications as small as 100 KB, like small little mobile apps or small little web apps, to apps that have been 6 GB in size. So you can imagine something that has that much code definitely has at least one vulnerability in it.
Now, the software we looked at was software that was both in production, and software that was in pre-production, it was tested before release – sometimes it happens, and hopefully it happens – and lots of different sources of software:
• Internally developed software, for enterprises building their own software;
• Open source that our customers want to use and want to understand the vulnerabilities in it;
• Vendor code, code that they’re purchasing. They’re looking at the vulnerabilities in that code before they actually pay the vendor for it;
• And, finally, we’ve been doing a little bit of looking at outsource code, but it’s a pretty small sample size.
In a few places I talk about outsource code, but in general outsourcers’ contracts prohibit their customers from actually doing any kind of security acceptance testing, because these contracts were written 5 to 7 years ago. I think that is going to change in the future, but right now a lot of open source code just has to be accepted by the customer, and if the customer finds vulnerabilities, then they say: “Oh, well, you need to pay us to fix them, because that’s a re-work cost”. So, have a little bit of data on that.
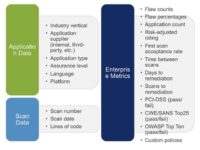
These are the types of data we collect (see image). Over here we have the application metadata, so we have some information about the application: what industry it is for, who supplied the software, who built it, we have some data on the type of application, especially for vendor, commercial vendor code, because we can just by the name of the application and the company look up what the software does, that’s not so easy to do on internally developed code. And of course we know things like language and platform. And we have our customers specify an assurance level based on their own risk scoring – do they see this as a critical or a high-risk app, or do they see it as a medium or low-risk app.
Of course we have scan data, that’s the data that we generate when we scan it: when was it scanned, what was the date, how many times it’s been scanned, and what are the findings.
And then we have metrics, which is really what I want to talk about, which is counts, percentages, time between scans, days to remediation, and then does it comply with some industry standards out there like OWASP Top 10 or CWE/SANS Top 25, if you put a policy on that and said: “The app has to have no OWASP Top 10 vulnerabilities in it, did the app comply or not?”
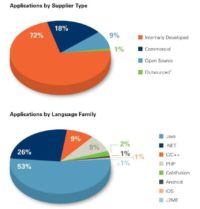
So, this is the data set (see image). You can see, most of the code we look at is internally developed code, this is enterprises sending us the code that they are building and they are going to operate, to make sure their developers did a good job.
And then, pretty significant is commercial code, this is code that’s being purchased by an enterprise, and during the purchasing process they’re going to have us test it. And then there’s also some open source, and then, as I said before, the outsource which is a pretty small slice.
This gives you a good idea of what languages enterprises are running, what kind of software they’re running, what kind of languages it was written in, and you can see Java is by far the most popular, followed by .NET, C/C++, PHP, ColdFusion. Surprisingly there’s a lot of ColdFusion development still out there, 2% is about 200 applications, that’s a significant number of applications.
Some of these platforms are pretty new to us. Android and iOS we just introduced last year, so we don’t have a lot of data on Android and iOS; even less on iOS, I have a little more data on Android apps that I’ll show you.
The Latent Vulnerabilities vs. the Attacks
A lot of organizations do incident response, they do managed security services, so they have data about the attacks that are happening. If you look at the Verizon data breach report, Trustwave has a report now, they talk about, when they do incident response, what the attack vector was, what was attacked, how they were attacked.
So, what we are doing here is we are talking about the latent vulnerabilities that are out there in the software, so it’s a very different view of the software landscape. It’s not what’s getting exploited; it’s what could be exploited.
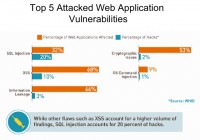
I did a comparison here of the top 5 most attacked web vulnerabilities (see image). And I found that the web hacking incident database, from the Web Application Security Consortium, actually had the best data that actually broke it down. A lot of the other reports just say it was a hack – it wasn’t a known vulnerability, it was a hack. They categorize that as, you know, someone found a SQL injection, but they don’t break it down from this, so it’s not very useful. So it would be great if Verizon or Trustwave could break it down, because then we could understand better what classes of vulnerability are being attacked at the software layer.
Web hacking incident database had the best data out there, and so the top 5 attacks for web apps: by far, number 1 was SQL injection at 20%. In orange is the percentage of web applications that are affected by this that we saw, so on our set of 10,000 applications, you know, 32% in the orange here had 1 or more SQL injection vulnerabilities in them. And from the web hacking incident database we see here that 20% of attacks on websites are SQL injections. So you can see that it’s obviously a popular attack and it’s in a lot of applications, so that makes sense.
But then you go and look at something like cross-site scripting (XSS), and we find cross-site scripting in 68% of the applications that we look at. But only 10% of the web attacks have cross-site scripting involved. So I think what you can kind of gather from it is that even though there’s a lot of cross-site scripting vulnerabilities out there, they’re not that useful to attackers. They’re not as impactful as, say, SQL injection. It’s a vulnerability that is sort of under-attacked. There’s lots of it out there. So, if you put your black hat on you could say: “Developers aren’t so concerned about cross-site scripting, so maybe I should figure out ways to better leverage and get better impact out of the cross-site scripting vulnerability.”
If you look at the next category that was information leakage, we found that in 66% of apps, and that’s only involved in 3% of hacks. So, again, that’s something that’s very common, but, I guess, attackers don’t find it that valuable – to attack with information leakage.
Cryptographic issues is another one we find a lot of – 53%, and only 2% of attacks involve cryptographic issues. Now I look at that, and if I put my black hat on I think: “Well, that’s probably because people don’t know how to exploit these issues very well, and if there were better techniques developed around finding and exploiting cryptographic issues, it would probably be a bigger problem.” So cryptographic issue is kind of a bundle of things, like SSL not being implemented properly; not doing certificate checks; allowing falling back to weaker ciphers; things like poor random number generation for security, critical values, things like that.
And then finally command injection – we only found it 9% of the time, but it was actually used in 1% of the attacks. So again, this is something that is showing that it’s probably a pretty impactful attack because of the pretty high ratio of the sort of latent ones out there being used in attacks versus what we’re seeing with information leakage and crypto – it’s really only a tiny bit that is being used.
Web Application Vulnerabilities
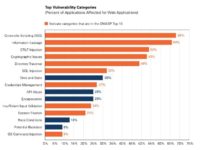
So, now we’re going to dive into our numbers (see chart). This here is the top vulnerability categories for web applications. These are the types of issues that we find.
Cross-site scripting we find in 68% of the applications we look at. Information leakage – 66%, CRLF injection – 54%, cryptographic issues – 53%, SQL injections 32%. So there is that number again, very highly attacked vulnerability coming at 32%.
The other thing I’ve done here is I’ve colored them orange if they’re in the OWASP Top 10. The OWASP Top 10 wasn’t really built with any empirical data. It was built anecdotally, with a bunch of security practitioners talking about what they saw a lot in applications and what they saw as attack classes of vulnerability that would be impactful if attacked.
But you can see they did actually a pretty good job, because now we have real data from several thousand applications. And you can see that, while we have a few things we find – time and state, API abuse, encapsulation, race conditions, that aren’t in the OWASP Top 10, most of the OWASP Top 10 actually does line up with the most prevalent vulnerabilities out there.
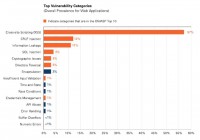
This is a little different view of the data, looking at the counts of vulnerabilities (see chart). So, the previous chart was one or more of a vulnerability in an application counted, and this is actually the raw counts of vulnerabilities.
You can see that 57% of the vulnerabilities we find are cross-site scripting, so it dwarfs everything else because it’s so prevalent. If an application was written by the developers who didn’t understand how to prevent cross-site scripting, they actually can end up with hundreds and hundreds of these issues.
Next was CRLF injection, information leakage, and then SQL injection was 4% of the vulnerabilities found. And a lot of these numbers are really low just because this is percentage-based, and cross-site scripting is kind of dwarfing everything else just from a raw prevalence perspective.
Non-Web Application Vulnerabilities
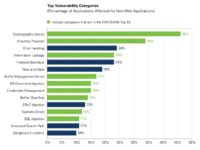
Now, on to non-web applications (see chart). So, for non-web applications we used the CWE/SANS Top 25. This is a list put out by Mitre CWE project and SANS, a bunch of people that got together on this sort of judging committee where we decided which were the most impactful and prevalent vulnerabilities, and what were those Top 25 issues.
You can see that, again, it’s colored in green if they’re in the Top 25. This one’s probably not lined up as nicely as the OWASP Top 10.
You can see cryptographic issues are very prevalent in non-web applications. One thing that really surprised me was directory traversal, how prevalent that is. Because we see that’s not really exploited that often, and that could allow an attacker to read or write potentially any file on the system. A filename is created with user-generated input. So my theory here is that people just aren’t looking for directory traversal because they don’t think they’re that valuable or they don’t think they’re going to find them. But I think that’s an area that if, again, I was putting my black hat on, I would start looking for directory traversal issues.
Again, you see down here in non-web applications we have some classes of issues like buffer management errors, buffer overflows, and numeric errors, which we don’t typically see in web applications, because web applications are usually written in scripting languages or in type-safe languages like Java and .NET which don’t have those problems.
So we’re seeing additional types of vulnerability issue up here in non-web applications because of languages like C and C++, which these things are pretty prevalent in. But, again, we’re only seeing buffer overflows in 14% of applications we look at; buffer management errors, another memory corruption class of vulnerability, in 17% of applications.
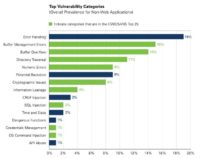
But then, when we slice the data and look at the overall prevalence of these categories (see chart). We see buffer management errors and buffer overflows are towards the top, at 15% and 14%. And that’s because of an application: if the application was developed with no concept of correct buffer handling, again, it’s like cross-site scripting, it just becomes a pervasive problem if the developers weren’t using proper bounds checking around their buffer management. And so, even though they’re in the low percentage of applications, they end up being towards the top in overall prevalence.
Error handling is still the biggest issue, but that’s not really that exploitable.
Another thing that is interesting is that we see a lot of potential backdoors, and that isn’t in the CWE/SANS Top 25, and that’s sort of a bundle of different things. It looks like there is some potential malicious code in there that could be put in either intentionally or not intentionally. And that’s things like hard-coded passwords and keys, hard-coded IP addresses, debugging functionality etc.
It’s not necessarily malicious, sometimes companies put this in their product for customer support reasons or the developers had it in there for debugging, and they left that in their shipping products. So it’s not always malicious; we actually find that more than you would expect, it’s at 9% of the issues we find.
Vulnerabilities by Language
So, next I want to take a look at this by language because the language you program in makes a big difference in the kind of vulnerabilities the application is going to have.
It is both sort of at a raw language level and in the types of APIs – whether it’s runtime or a framework that’s used to program in that language, that either supports writing secure code or doesn’t support writing secure code. And it’s also how the developers who are trained to write in these different languages can either support or not support secure programming.
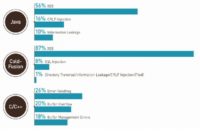
So, if we look at Java, we have cross-site scripting, CRLF injection, and information leakage. It seems fairly safe, because the top categories aren’t all that exploitable or they’re being exploited.
But if you look at ColdFusion, its second biggest category is SQL injection at 8%, so, you know, ColdFusion doesn’t really support a coding style, or the developers aren’t trained in such a way that they’re able to prevent SQL injection the way that Java developers are. So, what this tells me is if I run into a ColdFusion application, I’m much more likely to find SQL injection than if I run into a Java application. There are more Java applications out there though, but still, it shows that the language really does make a difference here.
And if we look down here at C and C++ we can see that buffer overflow and buffer management errors are number 2 and number 3. So, if you have that type of compiled C and C++, we all know that those are really endemic problems with programs written in those languages.
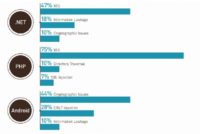
.NET looks a lot like Java was, with cross-site scripting and information leakage, but cryptographic issue shows up where it wasn’t on Java: you see that with Java number 3 is information leakage. So it tells me that .NET isn’t supporting writing cryptography as well, or the developers aren’t trained as well in cryptography.
PHP, again, is sort of like ColdFusion, it’s not supporting writing code that doesn’t have SQL injection in it as well as .NET and Java are. So, again, if you have a PHP application, you’re more likely to have SQL injection. And you can see here that directory traversal shows up, and directory traversal isn’t the top 3 of the other languages, and we get directory traversal showing up in PHP. So PHP, just from a web standpoint, looks pretty bad, right? It looks like we got some too serious categories here in addition to cross-site scripting, which seems to be everywhere. We have SQL injection and directory traversal. So, if anyone’s done auditing of PHP apps, they know that these issues are probably more likely with PHP apps.
And then I threw in the Android, even though we have a sample of only about 100 Android apps to show. What are we finding in the Android? And it actually ends up having a lot of cryptographic issues, which is pretty interesting. It looks like Android developers don’t understand how to use the crypto API as well on that platform, and they’re also baking in a lot of static crypto keys, which is definitely a bad idea.
Vulnerability Distribution by Supplier
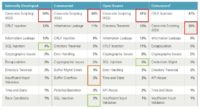
A lot of data here (see image), this is looking at the vulnerability distribution by the supplier type of the applications. Supplier type is who developed it: was it internally developed, was it commercial code, was it open source, was it outsourced?
And if you look across something like cross-site scripting – and take the outsourced stuff with a little grain of salt here because it’s a small sample size – you see this is pretty consistent. Everyone’s writing cross-site scripting errors; that’s really consistent.
SQL injection ends up actually being pretty consistent too: we got 4% for ‘Internally Developed’, 3% for ‘Commercial’, 3% for ‘Open Source’ . So, based on supplier type it looks like those are very consistent.
But if you look at directory traversal, it goes from 3% ‘Internally Developed’ to 6% ‘Commercial’ to 13% ‘Open Source’. So there’s definitely a difference with directory traversal. I have no idea why that might be; I haven’t been able to figure that one out. If anyone has any ideas why that would change, and it looks like significant numbers, I don’t know why that might be.
But this one is another thing that is different, it’s commercial code: we see buffer management errors and buffer overflow. And I know why that’s not in the other categories – that’s because they write their code in C and C++.
Vulnerability Distribution by Industry

And then we sliced the data by industry, so this is, you know, who is going to be operating the code, whether they built it themselves or they’re purchasing it. Who’s operating the code? And this ‘Government’ category is all US government; we don’t have any foreign government customers; for some reason they don’t want to send the code to the US – because of the USA Patriot Act, I think. But the government doesn’t mind, because they already have the code.
And then, finance and software were two other industry verticals that we had a significant amount of data in. You know, we do have data from retail, manufacturing, healthcare. But the sample size for those was less than a hundred apps, so I didn’t want to use that data. But for these we have thousands of apps in each of these categories.
And you can see that there is a significant difference with cross-site scripting: government – 75% of apps were affected, finance – 67%, and software industry – 55%. I think in the case with software industry it’s probably because they’re writing a lot of non-web apps, that’s probably part of the reason; but it’s interesting that finance is sort of doing a little better job writing their code to not have cross-site scripting.
SQL injection goes from 40 to 29 and 30 by industry, so government is writing code with a lot more SQL injection issues in it, they should definitely change something there. That looks like a pretty high number. So, if you’re going to attack government websites, I probably didn’t have to tell you this, but you’ll find SQL injection in there.
How Vulnerability Distribution Is Changing Over Time
So, then we looked at trends over time. Are any of these vulnerability distribution percentages changing over time? Because it would be nice to think that with more technology available for testing, more training available for developers – and we’ve known about these issues for a long time – that we might actually be writing better code over time. You think it could happen, right?

So we looked back 2 years on cross-site scripting. We looked at our database, we looked at our data for 2 years, and we found that cross-site scripting is essentially flat (see graph). It looks like the trend’s a little up, but the p-value has to be below 0.05 for it to be statistically significant. So, statistically it’s a flat line. In 2 years that code that we’ve seen at Veracode has not improved at all in terms of cross-site scripting, it’s almost exactly the same.
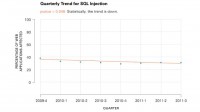
But for SQL injection, the trend is going down (see graph). Somehow, after dozens of break-ins every year, high-profile break-ins with SQL injection being the cause, it’s starting to make a difference, and the trend is down over 2 years. About 38% of applications were affected 2 years ago, and today we’re seeing about 32% of our applications being infected. Over a 2-year period it has decreased 6%, which seems slow, but it’s pretty good news, right? Actually there’s some good news in my report that it’s getting slightly better. I guess the bad news is that unless it accelerates, until it gets into signal digits it’s going to take 6 or 7 more years based on that trend. So, if we were seeing a lifetime of a vulnerability here discovered in 1998, by 2018, perhaps, it will be eradicated.
And then we said: “Let’s do a deep dive on one sector”. And we picked on the government this time, because that looks like fun. And we said: “How are they doing? All industries, all code, and how is government doing?”

So, again, with cross-site scripting it’s flat (see graph). We can see this grey line here that is the line from before for all industries, and the orange line is just for the government. Statistically, it’s flat.
And then if we look at SQL injection, it’s flat again (see image to the bottom right). It looks like it’s going up instead of down, like, this is the one before, the grey line going down; looks like it’s going up, but statistically it’s flat.

So everyone but government seems to be doing a good job at lowering SQL injection. Our government customers don’t seem to be able to do that. I think part of the explanation for that is there’s not enough training, for one thing; and if you look at the US government standards – there’s a standard from NIST called 800-53, which is security control standard that all government agencies in the United States have to abide by.
There’s a law called FISMA – the Federal Information Security Management Act. And whatever is in the controls in the 800-53, every agency in the US government is graded on this, and there’s nothing in there that specifies application security. Web apps are not mentioned, SQL injection is not mentioned – it’s things like ‘you must have encryption‘.
So, if there’s no compliance reason and there’s no risk-based reason, and there’s no cost reason to write secure code – you’re not going to. It just doesn’t happen magically, that’s why we have to have some standards, in the US government at least, to improve this situation. There’s a new version of 800-53 coming out later this year, which specifically mentions doing things like static and dynamic analysis while you’re building applications and for apps that you purchase. I think this is going to change, and it will be interesting to see over the next 2 years if my hypothesis is right and the trend for the US government starts to go down.
OWASP and CWE/SANS Compliance of Web Applications
Now, what percentage of web applications do you think fail the OWASP Top 10? The answer is 86%.
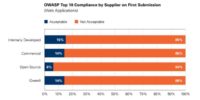
Open source actually came out the worst, and my theory is that open source web applications really aren’t written that well and they typically don’t do anything with financial data or credit card data. So they probably aren’t held to any kind of compliance standard. If we look at commercial and internally developed code, they’re doing the best, even though it’s really poor, because there are a percentage of applications that are held to a standard, like PCI compliance, or perhaps they were just well-written.
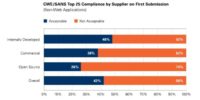
And then, if we look at the CWE/SANS Top 25, we didn’t find any issues at all on the whole CWE/SANS Top 25, which you think is a stricter standard because there’s 25 things to look for in there. Generally, software did better. And I think it’s just because things like cross-site scripting are so prevalent in web applications, it’s rare that you don’t find any. And it turned out that internally developed code actually did the best, followed by commercial and open source code.
Industries Holding Their Software Vendors Accountable
Then we looked at, you know, what industries are securing their supply chain; what industries are holding their vendors accountable. Because this is kind of a new concept, people started securing their own code because if they didn’t secure their own code, who is going to do it for them, right? If you’re writing the code, you have to.
But if you’re purchasing code, there is this kind of assumption that the vendors are doing the right thing. They must be, they are commercial software vendors, of course they’re writing secure code. I think that’s kind of a mentality, but people are starting to do security testing as part of their acceptance process when they purchase code.
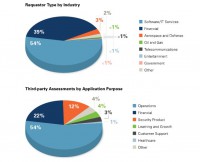
And so, these are the different industries that are using Veracode to do this (see upper chart), so by far the biggest is the software industry, and the IT services industry. It’s interesting to think about, but software companies actually buy a lot of software, both to run their operations and to include in a bundle the software they purchase from other companies, in their packages that they sell. So they are the biggest user of third-party risk management.
The second is the financial services industry, kind of on the leading edge of anything to do with application security.
And then we’re starting to see some emerging industries begin to care. We’re starting to see aerospace, oil and gas industries start to care about the code that they’re purchasing. And then we’ve seen a little bit from other industries, but it’s less than 1%. And it’s interesting to see that the government doesn’t really care about the code they’re purchasing.
We also looked at what types of applications people want to measure the security of (see bottom chart on the image above). It turned out that number 1 was operation software, like IT operation software; second was financial software; and security products was third, which I thought was pretty interesting that people are looking at the secure coding of the security products that they’re purchasing. And then we had learning and growth, and customer support.
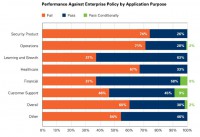
So that’s the data set that these next numbers come from (see image). We allow the companies to set an enterprise policy, so we didn’t use OWASP Top 10 here or the CWE/SANS Top 25; the companies set a policy, and it could have been a policy like that, but whatever their policy was, whatever they deemed was acceptable, they chose the policy and this data is based on what they chose. And it turns out that the worst code is actually coming from security products. 74% of security products failed. And if you look at financial products, only 37% failed. That’s a huge difference, it’s like twice as much. So software vendors that write financial packages are doing a good job writing secure code, and security product vendors are doing a bad job writing secure code.
It doesn’t surprise me; I used to work for a security company, but I think it’s a good wake-up call to the marketplace, and people have written about this before: as you layer on security products, onto your hosts, onto your servers, onto your networks, you’re actually layering on vulnerabilities along with layering on controls.
Next worst was operation software which, again, is things that run your IT infrastructure for instance. Again, not so good. But overall it was 60% failed.
Sometimes this testing is done during the acquisition process where they’re testing two products and they use the secure coding as one of the criteria, along with price, performance, features, they also use that as the criteria. So sometimes if a product is really, really insecure, they just won’t purchase it, and they’re done with it.
But, typically, if they purchase the product and it was insecure, what they’ll do is in the contract they’ll say: “Within a certain period of time you need to remediate the high and critical vulnerabilities.” So they basically say: “Ok, we’ll take it now, but we’re expecting your next point release, maybe in 3 months, maybe in 6 months, that you’re going to fix those problems.” So it can be used to reject something, but it can also be used to put a strong remediation plan in place with the vendor. That seems to work if it’s during the purchasing cycle, because the salesperson in the company wants to make the sale, and if it’s a big dollar amount, they’re willing to actually fix their code.
Code Quality by Types of Software Vendors
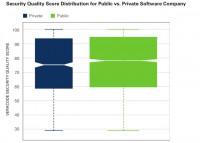
Another thing we took a slice on was software vendors. We wanted to see if there was any difference among the types of software vendors: whether it was a public company or private company; what their revenues were; whether big software companies wrote better code than small little tiny software companies, because, you know, we’ve tested code from software companies that had, like, 5 people.
And it turns out that public versus private doesn’t make much difference. This is a whisker chart (see image) where the middle is the median, and this is sort of the two standard deviations. It turns out that they’re very comparable – public versus private.
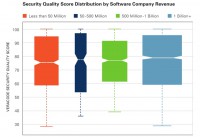
And then, also by revenues – up to 50 million, from 50-500 million, 500 to a billion, and more – pretty much the same. This actually is pretty surprising to me, because you hear from a lot of big software companies, Oracle being one of them, saying, you know: “We have a great security program; we’re a big company, big companies don’t need to have their code checked; we’ve got it covered.” And this data shows that that’s wrong; that small companies, medium-sized companies, large companies – it doesn’t matter, they all write about the same quality code.
Smartphone Application Vulnerabilities
I have a little bit of data here on smartphones. Like I said, we don’t have a lot of data because we just introduced Android and iOS static analysis middle of the last year. And we took the data through the end of the year to do our report on.
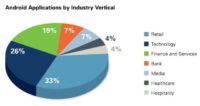
So, we have some data on the industry verticals (see chart). I should say that when we do Android applications, these are enterprise Android applications; we’re not going up to the marketplace and pulling down hundreds of apps and just looking through them. It’s something we could do, but we haven’t done that, and if we did that, then we’d get the distribution of what’s in the marketplace, which will be heavily slanted towards things like games, and personal productivity apps, and things like that.
But the apps that we’ve tested are apps that our enterprise customers are either building to give to their customers and partners or employees, or they’re buying. So they’re serving an enterprise purpose.
The breakdown is mostly retail, then technology companies, finance and services, banks, media, healthcare, hospitality. So these are all the different companies that are either buying or building enterprise mobile apps.

When we looked at them, the number 1 vulnerability was insufficient entropy, which basically just means that no one’s using secure random number generation on Android, they just don’t get the concept or something like that.
This one was really surprising though, it’s hard-coded cryptographic key, because that means if you have possession of the binary, you’re going to have possession of the key, which, I can see how an enterprise developer might think: “Well, it’s connecting to our back-end service and we’re only giving these applications to our employees, so everything’s cool. I can hard-code the cryptographic key.” But, you know, if the phone gets lost, the app gets taken off the phone, then you’re going to lose the key. So that’s always a bad idea to hard-code it, because you can’t change the key easily and there’s a huge amount of people that know the same key.
And we see this in regular Java applications, I think it’s about 18% of the time; we see it on the Java J2EE application. But it’s much worse on the Android, and it’s also much worse because of the threat model, right? You’d have to break in to the application server and be able to read the binary to get a hard-coded key in a web application, but on an Android device you just have to get access to the mobile app, which is widely distributed.
One of the other categories is information exposure through sent data – we saw 39%, because of the threat model of the mobile device, where a lot of big threats are not someone compromising the device through a buffer overflow or SQL injection and things like that, where they would take over the device to get the data. A lot of times the risk is that the app is written insecurely and is leaking data. So it’s leaking sensitive information in the clear, or it’s using sensitive information like the phone number and things like that as IDs and tokens in the way the app is built. So this is all about data that the user of the device doesn’t want sent off the device and it gets sent off.
This is a big emerging area in the mobile world, and it isn’t always that the app is written insecurely; sometimes the developer wrote it on purpose to have sensitive data go off the device, because that was their business model. We saw this big thing with the Path address book.
So, at Veracode we wrote a small app that just did a quick binary grab to see how many apps that you had installed happen to be for iOS, because it’s easier to look into your iTunes directory, and see how many apps you had installed that access the address book. There’s a method that bulk grabs the whole address book at once. And it turned out that we found hundreds of apps that are doing this. So sometimes it’s intentional that that’s going on. Of course, an enterprise purchasing a mobile app doesn’t want their employees’ address books all compromised by the mobile app provider, so that’s why they would be concerned; but individuals should be concerned too.
Assessment of Developers’ Secure Coding Skills

So, now I will talk a little bit more about the developers, and how well developers are doing about writing secure apps from an education standpoint. When given an exam on application security fundamentals, over half the developers – what grade do you think they received on the assessment test? How good are the developers in terms of security fundamentals?
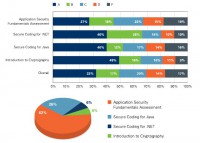
It actually turns out to be C. About half get a C or worse here with the application security fundamentals, so that’s the state up here. But you can see the breakdown of scores A, B, C, D, E and F for these different assessment tests (see chart). These are the top 4 assessment tests that we give out. This is a set of about 5000 developers that this data comes from.
Down here are the types of tests that organizations are asking their developers to take. 62% take the application security fundamentals, which is really basic stuff that applies to every language, like theories of least privilege, input validation – those very basic concepts that apply across all languages and platforms.
And then we have tests like secure coding for .NET, which is .NET’s specific issues – the .NET APIs for Java, and Intro to cryptography. And it’s interesting that developers actually do pretty well in cryptography, and if you ask a developer if they learned security at school, they say: “Yeah, I learned security at school; I took a course on cryptography.”
So cryptography is actually taught at the collegiate level, and so a lot of developers, more than a half of them, got an A or a B; actually, almost half got an A on crypto concepts, which again, I think, shows that if you educate the developers, they’ll actually know what they’re doing.
But if you look at security fundamentals, which you think are the really basic things that we all know about building secure systems, developers actually fare the worst. They don’t really understand concepts like least privilege, attack surface reduction, and things like that.
And then another difference here that is interesting – the secure coding for .NET did a little bit better than secure coding for Java. A and B come to 66% versus 52% here, so that seems significant to me, and my theory there is – and I’ve looked at the .NET documentation – it talks a lot about using the security features, things like outputting coding and input validation, and it’s right there in the .NET documentation. So I think just by learning how to use, learning how to code in .NET, the developers absorb some secure coding concepts, while that’s just not happening with the Java developers.

Then we took a look at whether we can correlate the test scores that the developers on the particular development team got with the security quality score that we generated for that application (see graph).
And it turns out that it doesn’t really correlate very well. So we were hoping to see that people that did well on the tests, so they knew about secure coding, actually wrote more secure apps, which would show a nice trend line here, right? But it looks like it’s spread all over the place.
So I think we need to do a better job isolating our data. One of the problems is a developer could take a test and then join the development team that has written bad code for 10 years, and he’s on that team now; he might be writing good code, but there’s such an amount of bad code, and it’s hard to isolate that.
So, what we really need to do is look at pieces of code that were written by a particular developer, and we can’t just conflate teams and applications together. That’s something I’d like to work on to actually show the value of education, because, you know, intuitively it makes sense, right? But I don’t think anyone has empirically shown that it makes a significant difference.
A lot of companies are spending money to train all their developers, hoping that there will be an effect. And I hear a lot of people say: “I’m doing an AppSec program, the first thing we’re going to do is we’re going to train our developers.” I hear that probably half the time. And I say: “Really, what you should be doing is testing, because then you put in a verification, you’re putting in an enforcement mechanism that’s going to force you to remediate things. But then you need a policy and hold your developers accountable to do something; and that’s harder to do than offer training.”
So, besides this interesting math problem here, that was all I had for data.


